
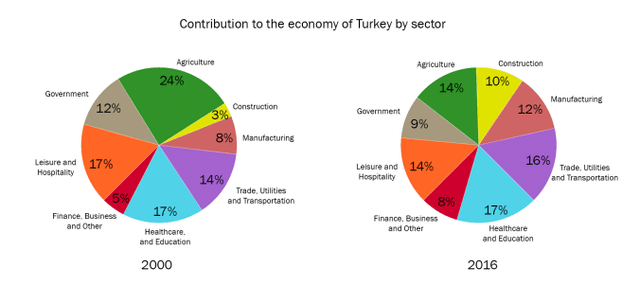
The two pie charts display the difference in contribution per cent of eight industrial sectors which developed during Turkey's recession in 2000 and 2016.
In general, The major industry in 2000 year was Agriculture, but in 2016 Health and Education became the most developing sector,
while
the minor sector of 2000 and 2016 was Construction Finance and business sectors respectively.
Linking Words
To begin
with, the most outcome Linking Words
to
Turkey's government in the 2000s was gained from Agriculture Leisure & Hospitality and Education & Business spheres, as the data which was collected in the 2000s year showed 24%, 17% and 17%, sincerely. Change preposition
for
On the other hand
, the least significant economic sectors were Construction (5%), Finance & Business (Linking Words
also
5%) and Manufacturing (8%).
By 2016, analyzing the scheme, it noticed that agriculture lost 10% of its income and Health and education became the most wealthy sector, as its output was 17% of the country's economy.Linking Words