
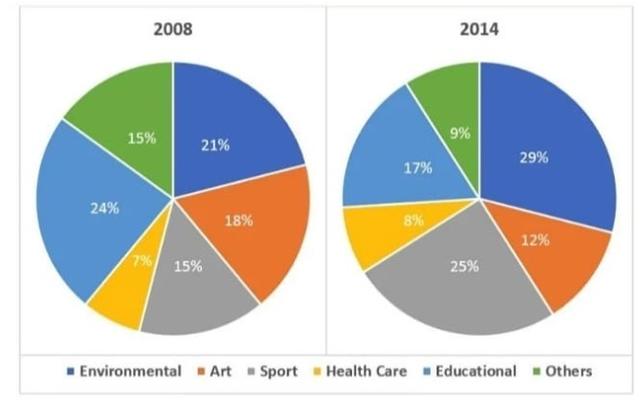
The pie charts demonstrate the percentage of participants from different organizations in 2008 and 2014.
Overall
, Linking Words
it is clear that
the participation of organizations represents the largest portion of the environment, sports, and Linking Words
health
Use synonyms
care
, Use synonyms
whereas
art, education, and others are undoubtedly the smallest. Over and above that Linking Words
health
Use synonyms
care
was the least popular throughout 2 years.
Use synonyms
According to
the illustration, the figure of volunteers in 2008, volunteering from educational topped the list with a percentage of 24%, slightly higher than environmental at 21%. Linking Words
Furthermore
, the percentage of participants in art is around 18%, as opposed to 15% in sports and others. Meanwhile, volunteers' work in Linking Words
health
Use synonyms
care
only amounted to 7%.
Use synonyms
On the other hand
, a sharp increase in volunteering for environmental and sports organizations exactly 29% and a quarter in 2014. Linking Words
This
is Linking Words
then
followed by education at around 17% and art at 12%. The lowest was followed by other kinds of volunteering organisations with 9%, making it slightly more well-known than Linking Words
health
Use synonyms
care
at just 8%.Use synonyms