
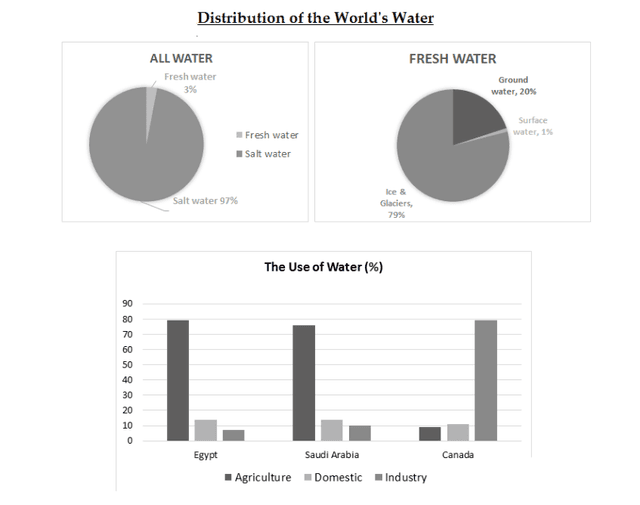
The charts illustrate the distribution of the world's
water
and the percentages of Use synonyms
water
use in Use synonyms
three
different sectors in Use synonyms
three
countries.
Use synonyms
Overall
, it is evident that salt Linking Words
water
accounts for the vast majority of Use synonyms
water
on Earth, with the rest composed of fresh Use synonyms
water
. In the bar chart, Use synonyms
water
is used the most for agriculture in Egypt and Saudi Arabia, Use synonyms
while
industrial Linking Words
water
use is the most predominant in Canada.
The pie charts reveal that salt Use synonyms
water
makes up 97% of the total Use synonyms
water
and freshwater comprises a mere 3%. Use synonyms
In addition
, freshwater constitutes 79% of ice and glaciers, 20% of groundwater, and 1% of surface Linking Words
water
.
Shifting our focus to the Use synonyms
three
nations' Use synonyms
water
consumption patterns, the share of the agriculture category is the highest in Egypt (80%) and Saudi Arabia (75%), starkly contrasting with that of Canada at only 10%. Use synonyms
Conversely
, Linking Words
while
the industry sector utilizes a substantial 80% in Canada, the figures for Egypt and Saudi Arabia only record 5% and 10%, respectively. Interestingly, the shares of domestic Linking Words
water
use were similar among the Use synonyms
three
nations, at 10% or less.Use synonyms