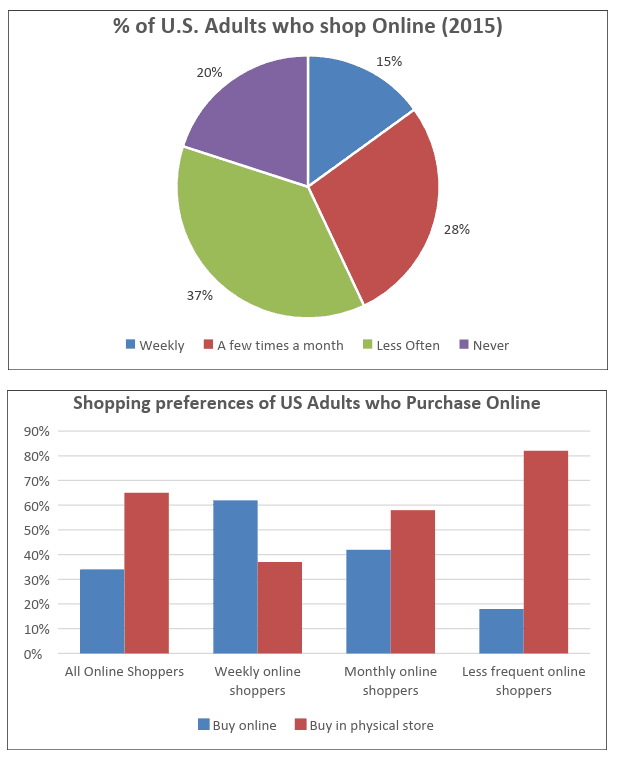
The pie chart below shows the frequency of U.S. Adults’ online purchasing habits in 2015, while the bar chart shows a further classification denoting online purchasing preferences. Summarise the data by selecting and reporting the main features and make comparisons where relevant.

The pie chart below shows the frequency of U.S. Adults’ online purchasing habits in 2015, while the bar chart shows a further classification denoting online purchasing preferences.

Summarise the data by selecting and reporting the main features and make comparisons where relevant.
The pie
chart
illustrates the proportion of online buying by American adults in 2015, whilst the bar
chart
depicts the percentages of those who like shopping in different
market places
Correct your spelling
marketplaces
show examples
. From the two charts, it can be seen that the highest percentage of people who bought online
was for
Verb problem
apply
show examples
the
Correct article usage
apply
show examples
less often and most
of
Change preposition
apply
show examples
adults
preffered
Correct your spelling
preferred
physical shopping to online shopping.
According to
the pie
chart
, people who were not often buying goods from virtual shops accounted for 37% and those
that
Correct pronoun usage
who
show examples
had a few times to shop reached more than a quarter.
Moreover
, less than a fifth of people never purchased online which was slightly higher than the weekly buyers standing at 15%. Meanwhile, from the bar
chart
, the less frequent customers buying products from
physical
Add an article
the physical
show examples
market had the highest percentage around
four-fifth
Fix the agreement mistake
four-fifths
show examples
. There was a similarity between all and weekly online buyers which purchased more goods from physical shops at around 60% and under 40% from virtual stores,
Submitted by e.warikar on

Unauthorized use and/or duplication of this material without express and written permission from this site’s author and/or owner is strictly prohibited. Excerpts and links may be used, provided that full and clear credit is given to Writing9 with appropriate and specific direction to the original content.

Vocabulary: Replace the words chart with synonyms.
Vocabulary: The word "chart" was used 5 times.
Vocabulary: The word "percentages" was used 3 times.
Vocabulary: The word "around" was used 2 times.
Topic Vocabulary:
  • pie chart
  • bar chart
  • online purchasing habits
  • frequency
  • classification
  • summarise
  • main features
  • comparisons
  • demographics
  • consumer trends
  • e-commerce
  • data interpretation
  • purchasing categories
  • fiscal analysis
  • technological influence
What to do next:
Look at other essays: