
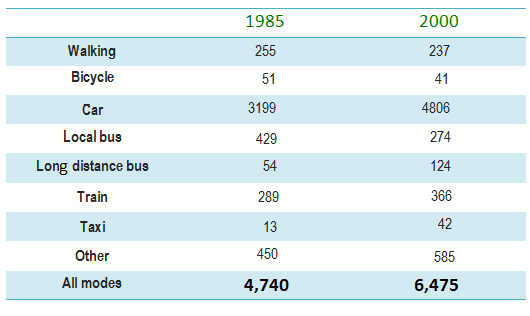
The given table compares the proportion of changes in travel modes in two years,1985 and 2000 in England.
Overall
, the total modes of travel mostly increased after five years, except for the figures for walking and cycling. England's people changed the highest percentage of their travel moods on the car, local bus, train and other Linking Words
vehicles
.
In 1985, car usage of the public was 3199, followed by 429, 289 and 450 in public bus, train and other Use synonyms
vehicles
respectively. The lowest figure was recorded in the taxi, bicycle and long-distance bus sector. After 5 years, the changes in the mood of Use synonyms
vehicles
climbed by 5% to 25%.
Regarding the data for 2000, the usage of cars increased and created the most value in England's transportation system. Use synonyms
Similarly
, the rate of changes on the local buses, long-distance buses, trains, taxis and other transport Linking Words
vehicles
increased slightly, but the opposite was true for walking and cycling whose figures decreased by about 2% to 5% over the period.Use synonyms