
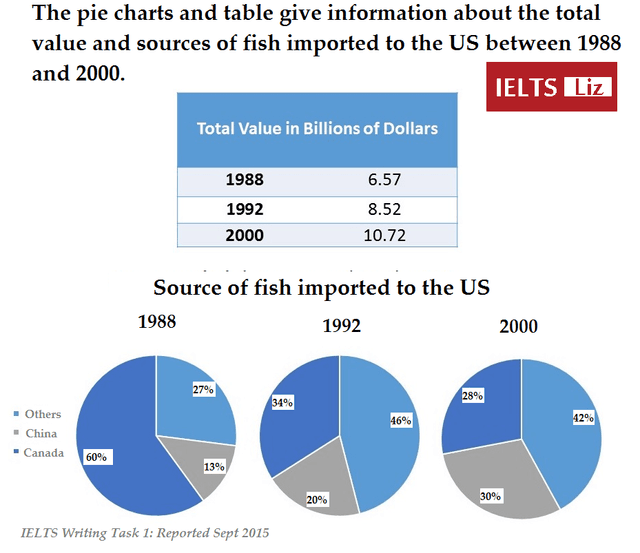
The pie charts and table illustrate the total value of fishing in the US and three different countries which imported fish to the US between 1988 and 2000.
Overall
, it can be seen that the total value of fishing rose throughout Linking Words
period
. Add an article
the period
Additionaly
, in the Correct your spelling
Additionally
beginning
Add the comma(s)
beginning,
percentage
of Use synonyms
Canada
far exceeded Use synonyms
from
the other figures, Change preposition
apply
however
in 2000 Linking Words
this
category represented Linking Words
in
the lowest Change preposition
apply
percentage
.
In detail, the total value of fishing was 6.57 Use synonyms
billions
Fix the agreement mistake
billion
of
dollars in 1988 and Change preposition
apply
this
figure gradually increased over the period, with approximately 2 Linking Words
billions
Fix the agreement mistake
billion
of
dollars Change preposition
apply
rose
per year, Verb problem
apply
reached at
10.72 Wrong verb form
reaching
billions
Fix the agreement mistake
billion
of
dollars in 2000.
Turning to the pie charts, Change preposition
apply
Canada
had the highest Use synonyms
percentage
in 1988 (60%) which almost doubled the rate of others’s Use synonyms
percentage
in that year. Meanwhile, China had the lowest Use synonyms
percentage
at 13%. The category of others peaked in 1992 Use synonyms
an
represented 46% in 1992. Correct your spelling
and
This
figure followed by Linking Words
Canada
and China, accounted for 34% and 29%, respectively. The pie chart which symbolises the year Use synonyms
of
2000, the category of others was higher (42%) than the other two categories, the second Change preposition
apply
significant
Correct quantifier usage
most significant
percentage
Use synonyms
was belonged
Change to the active voice
belonged
has belonged
China
which nearly Change preposition
to China
one
Correct pronoun usage
apply
in
Change preposition
apply
third,
Linking Words
at
followed by Change preposition
apply
Canada
which dramatically decreased over the period from 60% to 28%.Use synonyms