
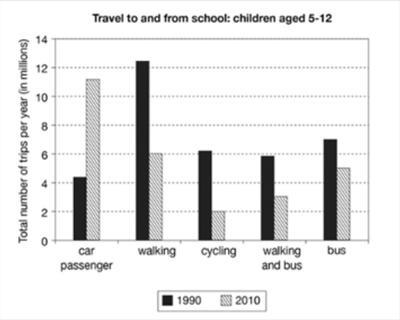
The bar chart displays the number of student's mobilities from and to their schools in a country in 1990 and 2010. The data portrays different forms of trip options,
such
as car, bicycle, Linking Words
bus
, walking, and the combination of Use synonyms
bus
and walking. As displayed on the chart, there was a total transformation of travel mode choice between these two separated years. Kids in 2010 preferred automobiles rather than other choices, contradicting the children's preference in 1990.
The highest modality option that the children chose in 1990 was Use synonyms
traveling
by foot, Change the spelling
travelling
totaling
more than 12 Change the spelling
totalling
million
per year. Use synonyms
Bus
, cycling, and walking-Use synonyms
bus
integration came far behind, averaging half of the total trips made by walking. Use synonyms
However
, the amount of parents who drove their children using a car was not common Linking Words
then
, with only four Linking Words
million
in total.
Contradict to the previous period, car trips dominated the chart Use synonyms
at the end
of the period, achieving as high as 11 Linking Words
million
travels. The foot and the combination of Use synonyms
bus
and walking approach reduced significantly by only half of the trips conducted in 1990, Use synonyms
while
Linking Words
bus
travel only decreased by 2 Use synonyms
million
in the latter year. Cycling was the Use synonyms
last
option for kids in 2010, showing only a third of the 1990 trip data in the same categories.Linking Words