
The table and pie chart illustrate the amount of electricity
as well as
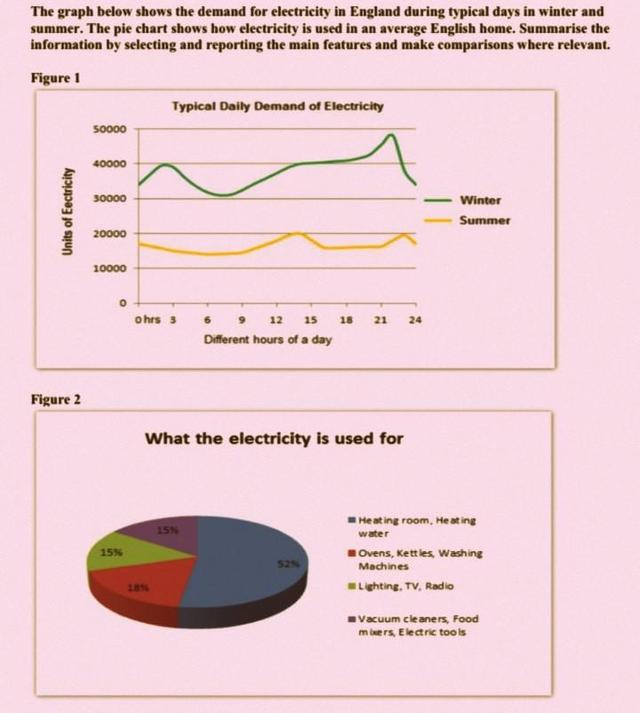
the common usage of the resources in the household.
Linking Words
Overall
, it can be seen that the trend followed by people regarding the hours, is the same in both summer and winter Linking Words
while
winter's consumption is substantially higher. Linking Words
Furthermore
, Linking Words
it is clear that
the main purpose of the consumed power is to heat.
Linking Words
According to
the data, it can be said that the most significant portion of the consumed commodity during the day is about 9 to 12 pm throughout the year. The lowest intake is for around 6 to 9 o'clock. Despite the pattern for both hot and cold seasons being the same, the fluctuations are noticeably larger in lower temperature times. As the main goal of the energy is heatening, winters use twice reaching an average of 35 thousand units.
Linking Words
Although
more than half of the spent resource is allocated to producing heat, cleaning tools media and kitchen tools should not be overlooked. The three have an almost even distribution with media and and cleaning tools arriving at 15%. Linking Words
Moreover
, it seems like the kitchen is a bit more of an important location in the house as it holds 18% of the incoming electricity.Linking Words