
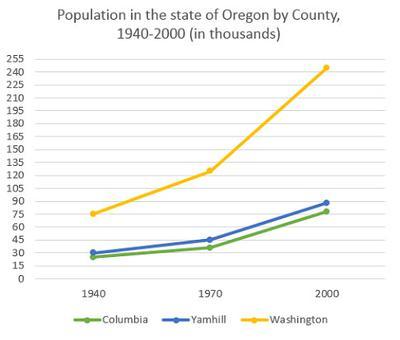
The given line graph indicates data about
alteration
of residence in three disparate provinces of Oregon from 1940 to 2000.
It is crystal clear that Washington was by far the most popular state in 1940 with 75 Add an article
the alteration
an alteration
thousand
inhabitants, and surged to 120 Use synonyms
thousand
in 1970. Use synonyms
Moreover
, Linking Words
this
number reached a peak at 141 Linking Words
thousand
Use synonyms
n
2000.
Correct your spelling
in
Further
, Yamhill was the second most crowded country with 30,000 and the population jumped to 75 Linking Words
thousand
in 2000. Use synonyms
Furthermore
, the same pattern is right for Columbia province which had approximately 28,000 people in 1940Linking Words
,
but grew to about 76,000 individuals in 2000.
Remove the comma
apply
Overall
, it is clearly evident that the three countries experienced Linking Words
same
increasing patterns. Correct article usage
the same
Last
but not least, Washington had the most crowded Linking Words
unlike
Columbia which had the least one.Add the comma(s)
, unlike