
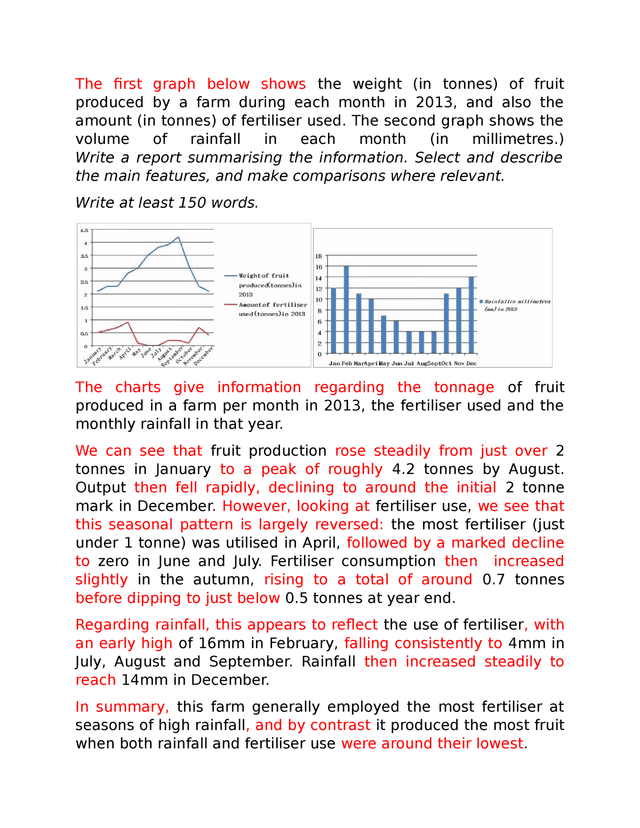
The line graph compares the quantity of fruit harvested and the sum of compost utilized during the 12 months of 2013 by farmland. The bar chart depicts the amount of rain in each month.
It can be seen that the amount of products in
September
was at its peak. In February the quantity of rainfall dramatically increased.
Use synonyms
According to
the line graph, with the rise of fertilizer from 0.5 Linking Words
tonnes
to about 0.75 Use synonyms
tonnes
the number of products put up in 3 first months of the year, after that, the rate of compost dropped and over June and July the fruits didn't compost approximately, whilst the weight of produced fruit significantly increased to about 4.2 Use synonyms
tonnes
in Use synonyms
September
. From the end of Use synonyms
September
until the end of the year, the figures for fruit diminished to its first weight Use synonyms
at
about 2.2 Change preposition
of
tonnes
Use synonyms
whereas
the farm received more fertilizer.
Looking at the bar chart, in 2013, over February rained more than in other months at around 16 Linking Words
millimeters
, and Change the spelling
millimetres
this
proportion fell constantly until July, with just 4 Linking Words
millimeters
of rainfall. the sum of the rain was stable from July to Change the spelling
millimetres
September
and Use synonyms
then
it started to go up strikingly to 14 Linking Words
millimeters
in December.Change the spelling
millimetres