
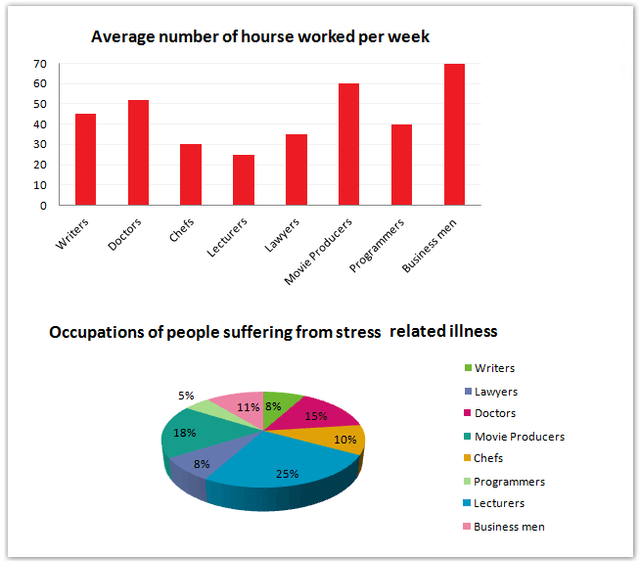
Two graphs give different information related to eight professional groups. The bar chart indicates the number of weekly work
hours
done by the groups Use synonyms
while
the pie graph illustrates the percentages of people suffering from stress-related illness in the different professions given.
In general, Linking Words
businessmen
industry is the longest among the eight groups Correct article usage
the businessmen
while
the smallest amount of time is normally worked by Linking Words
lecturers
. Use synonyms
According to
the pie chart, Linking Words
lecturers
struggle the most with work-related stress. Use synonyms
Although
their average working Linking Words
hours
are smaller than any other group in the chart, Use synonyms
lecturers
suffer from the highest level of stress caused by their jobs.
The bar graph shows that businessmen and movie producers work the most at about 70 Use synonyms
hours
and 62 Use synonyms
hours
per week respectively. At the opposite end of the scale, Use synonyms
lecturers
work only around 25 Use synonyms
hours
. Working Use synonyms
hours
of other professionals varied with doctors, writers, programmers, lawyers and chefs working approximately 52, 46, 35 and 32 Use synonyms
hours
per week in the name ordered.
The pie graph shows that the professional who has the highest incidence of stress-related illnesses is Use synonyms
lecturers
at 25%. Movie producers and doctors Use synonyms
also
have high rates with 18% and 15% each. The figures for businessmen, lawyers, chefs and writers can be grouped into percentages between 11 and 8%. The lowest rate of stress illness is attributed to programmers at only 5%, which is only a fifth of the figure for Linking Words
lecturers
.Use synonyms