
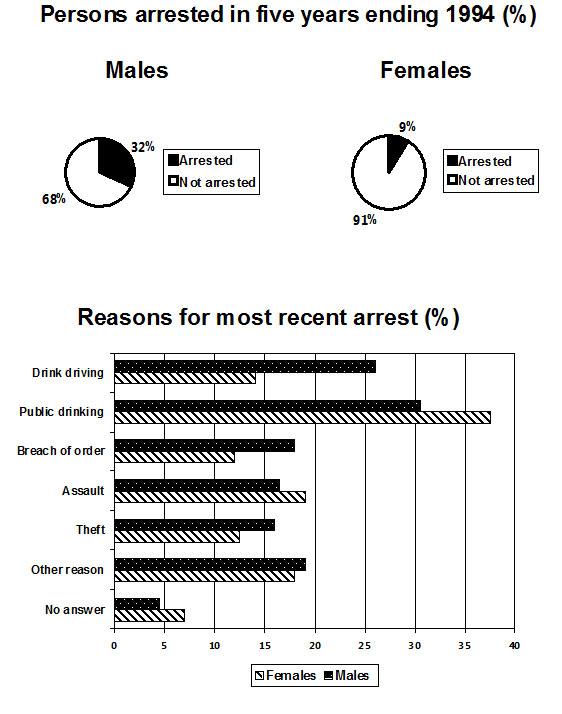
The pie charts demonstrate the percentage of
females
and Use synonyms
males
arrested between 1989 and 1994, Use synonyms
whereas
the bar chart shows by gender what they were arrested for and the percentage of arrests for every crime.
Linking Words
Overall
, Linking Words
males
were arrested more than Use synonyms
females
and public drinking was the most common crime for both genders.
It can be seen from the chart that the proportion of Use synonyms
males
arrested was much higher than for Use synonyms
females
. 32% of them were arrested during the given time, compared to 9% for Use synonyms
Correct article usage
apply
the
Correct article usage
apply
Fix the agreement mistake
females
female
Fix the agreement mistake
females
one
. Fellow tended to be arrested for drunk driving more than Correct pronoun usage
apply
females
, at about 25% and slightly under 15%, about twice the time. Theft, breach of order and other reasons were Use synonyms
also
greater for men, with the average percentage being about 20% for men and 10% for women, not including public drinking.
On the opposite, girls had a greater rate of arrests for public drinking, assault and no answer. Linking Words
Females
tended to be arrested for public drinking more than Use synonyms
males
, at above 35%, compared to 30% for Use synonyms
males
. Use synonyms
Also
, approximately 5% of both genders didn't tell why they were arrested.Linking Words