
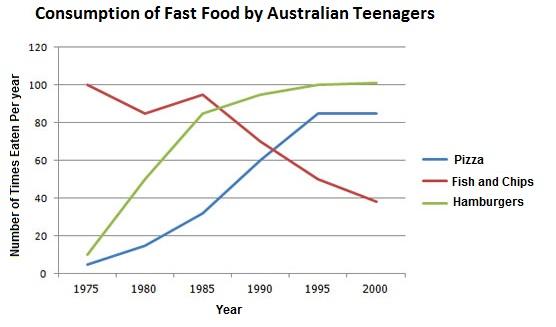
The given line graph illustrates how much fast food was eaten by
Australia
adolescents over a Correct your spelling
Australian
period
of 25 years between 1975 and 2000. Unit Use synonyms
are
measured in Change the verb form
is
number
of times eaten per day.
Change the article
a number
the number
Overall
, it can clearly be seen that the food with the highest level of Linking Words
consumption
at the Use synonyms
start
declined Use synonyms
whereas
the other two foods increased throughout the given Linking Words
period
. Use synonyms
Moreover
, Linking Words
while
the Linking Words
consumption
of fish and chips was the highest at the Use synonyms
start
, it had been overtaken by hamburgers by the end of the Use synonyms
period
.
In terms of the food with Use synonyms
highest
level of Change the article
the highest
consumption
at the Use synonyms
start
, the Use synonyms
consumption
of fish and chips stood at exactly 100 in 1975. The Use synonyms
consumption
Use synonyms
then
had a moderate drop to just above 80 in 1980 before growing slightly to nearly 100 in the next five years. From Linking Words
this
point onwards, it experienced a drastic decline and hit a trough just below 40 in 2000.
Regarding two other foods with lower levels at the Linking Words
start
, the Use synonyms
consumption
of pizza and hamburger started at around 5 and 10 respectively. The Use synonyms
consumption
of pizza Use synonyms
then
experienced a dramatic rise to just above 80 and remained steady in 1995. Linking Words
Similarly
, the Linking Words
consumption
of hamburgers climbed sharply to around 85 and peaked at Use synonyms
pricesely
100. Correct your spelling
precisely
Thereafter
, both remained stable by the end of the Linking Words
period
.Use synonyms