
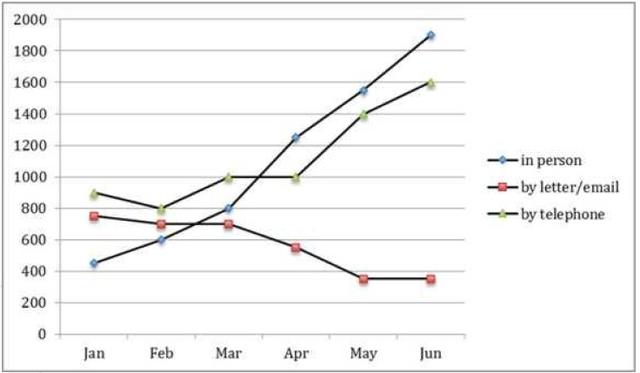
The line chart visually illustrates the
number
of inquisitions for the Tourist Information Office in one city in a six-month period in 2011. Use synonyms
Overall
, it is noticeable that questions asked in person and by telephone increased Linking Words
whereas
the Linking Words
number
decreased for enquiries by letter or email.
In January 2011, questions asked in person stood at nearly 400 and went up to 600 in the next month. The figure remained increasing until it reached just over 1800 in June. The Use synonyms
number
for the telephone channel was similar, it started at about 900 and moderately dropped to 800 in February. In the next month, it rose again to 1000 and kept at the same Use synonyms
number
a month after that. And Use synonyms
then
, it grew to 1600 in June.
Channel through letter or email, Linking Words
on the other hand
, had decreased over the months. Linking Words
Initially
, it was slightly below 800, and Linking Words
then
it kept decreasing to half in May and stabled in June.Linking Words