
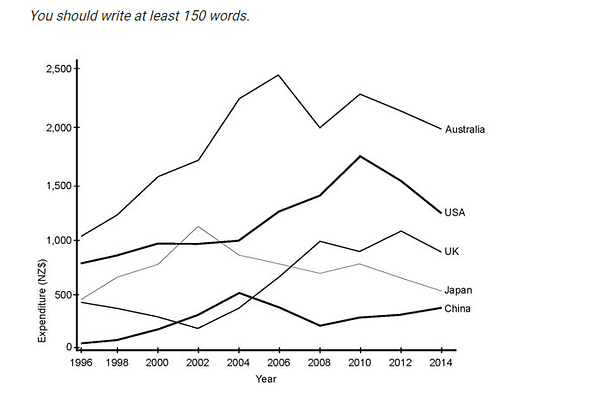
The line chart displays the yearly tourist expenditure in New Zealand from 5 different countries between 1996 and 2014. The most significant fact is that Australians always became the biggest spenders throughout the recorded period.
Initially
, in 1996 visitors from Australia spent over NZ$ 1000 Linking Words
while
people from China rarely gave any money when visiting New Zealand. Meanwhile, In 2002 and the next two years China was never in the Linking Words
last
position as the UK tourists started at around NZ$ 500 and sunk into its half before they rose again and became the third most spenders after Australia and the USA.
Other the other hand, Japanese communities spent similar numbers like the UK in the early years. Linking Words
However
, from 2000 until 2004 they went above and became the second dominant group before the USA and the UK took their position and Japan became the second lowest spender. Linking Words
Furthermore
, the biggest number of visitor gave out their money in 2004 as Australians paid out slightly less than NZ% 2500 in their time in New Zealand and the smallest number in the shown data was given by the Chinese in 1996.Linking Words