
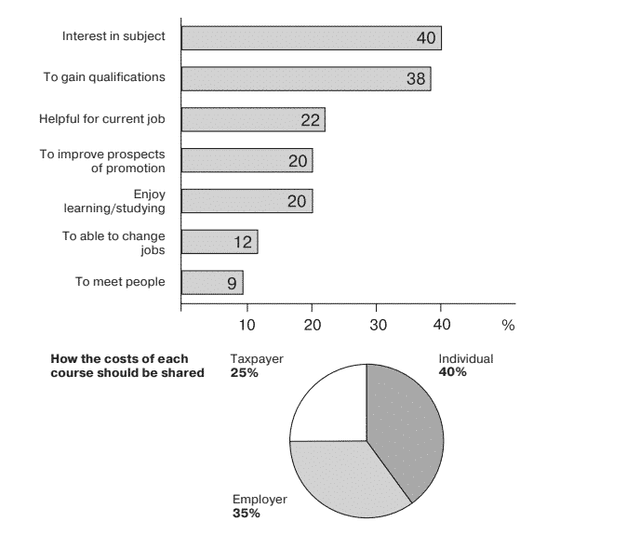
The bar
chart
displays the Use synonyms
causes
leading the adults to education by percentage, Use synonyms
while
the pie Linking Words
chart
distributes the costs that should be shared Use synonyms
of
the courses.
Change preposition
by
Overall
, we can clearly see from the bar Linking Words
chart
that "interest in the subject" and "to gain qualification" are the major Use synonyms
causes
behind adult education, and "interest in the subject" is the highest one. Use synonyms
On the other hand
, from the pie Linking Words
chart
, individuals bear the highest cost and employers take the second highest portion.
At Use synonyms
first,
the bar Linking Words
chart
represents seven Use synonyms
causes
and among them, 40% and 38% of adults go for courses of their interest in the subject and to gain some qualifications respectively. Use synonyms
Additionally
, only 12% and 9% of people take it to able to change jobs and meet new people respectively. There are other three Linking Words
causes
which share nearly similar percentages on the Use synonyms
chart
.
Use synonyms
Furthermore
, the pie Linking Words
chart
clearly shows the highest value of 40% among the cost shares of individuals. Use synonyms
Conversely
, 25% goes to taxpayers which derives from the expectations of the people.Linking Words