
The table shows information about the changes in people who visited for national travel in kind of areas
such
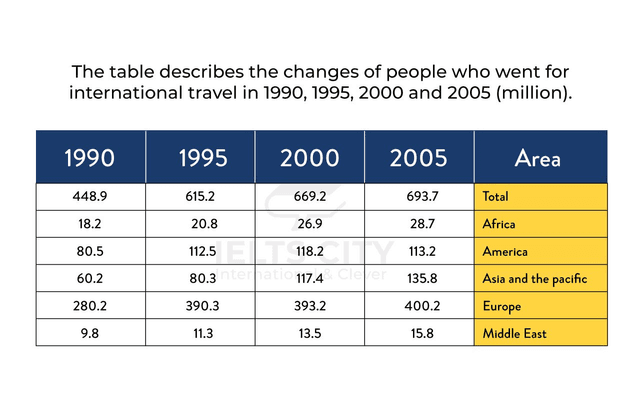
as Africa, America, Asia and the Pacific, Europe, the Middle East, and Total in 1990,1995,2000 and 2005. As can be seen from the table, it is obvious that there is an increase in the figure in every country year on year.
In detail, there are the least changes in visitors in the Middle East, with 9.8 in 1990 and Linking Words
then
Linking Words
this
figure gradually rose, with 11.3, 13.5, and 15.8 in 1995, 2000, and 2005, respectively. Linking Words
Also
, Africa has a growth rate similar to the Middle East. Meanwhile, Europe has the highest number of travellers, accounting for approximately 280 in 1990, Linking Words
then
there was a dramatic increase in Linking Words
this
number in 2005 with 400.
Looking in detail, America is the only country which has a drop in the change rate of visitors in 2005 with 113.2, Linking Words
while
the year before it was 118.2. Linking Words
Lastly
, Asia and the Pacific started at 60.2 and ended at 135.8.Linking Words