
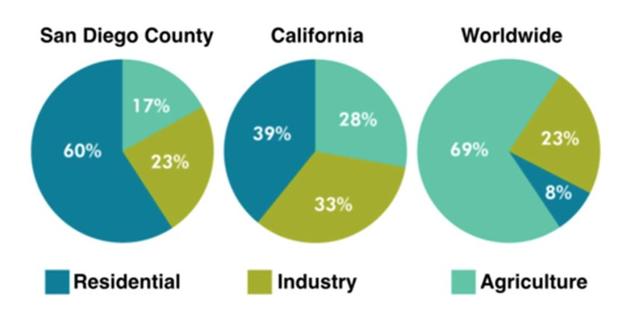
The
given
Verb problem
apply
pie
Use synonyms
chart
illustrates the Use synonyms
water
usage for three different purposes in Use synonyms
San
Use synonyms
Diego
, Use synonyms
California
, and the rest of the world.
From the first Use synonyms
pie
Use synonyms
chart
it is obvious that in Use synonyms
San
Use synonyms
Diego
, 60% of Use synonyms
water
is used for residential, which is the highest use, Use synonyms
whereas
only 23% and 17% of Linking Words
water
is used for industry and Use synonyms
agriculture
respectively.
The second Use synonyms
pie
Use synonyms
chart
depicts that Use synonyms
in
Change preposition
apply
California
Use synonyms
also
used 39% of Linking Words
water
for residential. They used 33% for industry, which was more than Use synonyms
water
used in Use synonyms
San
Use synonyms
Diego
and worldwide. About 28% is for Use synonyms
agriculture
in Use synonyms
California
.
Use synonyms
Linking Words
Finally
the third Add a comma
Finally,
pie
Use synonyms
chart
shows the rest of the world, a very small portion, where 8% of Use synonyms
water
is used for residential purposes . It is interesting to note that worldwide the maximum Use synonyms
water
use (69%) is for Use synonyms
agriculture
and 23 % for industry.
Use synonyms
Overall
, Linking Words
it is clear that
Linking Words
water
usage for residential is a very valuable commodity in Use synonyms
San
Use synonyms
Diego
and Use synonyms
California
, Use synonyms
while
Linking Words
in
the rest of the world shows the opposite with maximum Change preposition
apply
water
usage for Use synonyms
agriculture
.Use synonyms