
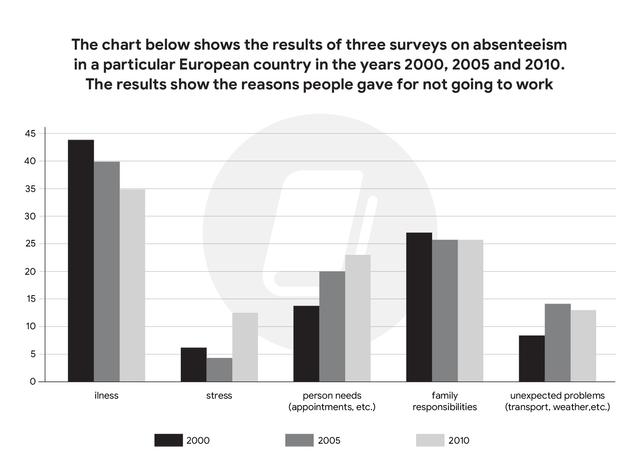
The bar chart illustrates the data of three studies regarding non-attendance of work conducted in a specific European country in 2000, 2005 and 2010.
Overall
, it is noticeable that sickness was consistently the major cause for not attending work Linking Words
whereas
stress was the opposite case. Linking Words
Furthermore
, the number of employers using health-related explanations and family obligations saw a downturn. Meanwhile, those using personal needs problems as the reason experienced an upward trend and the two other reasons witnessed an oscillation over the given time.
In detail, 43 per cent of the reasons for absenting from work was illness in the year 2000, Linking Words
this
rate Linking Words
then
decreased substantially in the next 2 timelines, which was 40% and 35%, respectively. Turning to family duties, there was a moderate plunge from 2005 to 2010, and Linking Words
then
from 2010 onward, Linking Words
this
number stayed unchanged at 25%.
Linking Words
In contrast
, the percentage of personal business surged significantly in 3 selected milestones. Specifically, it accounted for approximately 13% of causes in the first year and jumped by roughly one-third in the next 5 years. In the end, it hit the highest point of 23% in the final year. Linking Words
Next,
there was a fluctuation in the proportions of both stress and unpredicted problems. In 2000, pressure and undesirable issues took over 6% and 8% in turn. Over the next period, stress saw a slight drop Linking Words
while
there was a sharp rise in unexpected problems and both Linking Words
finally
reached the rate of around 13% Linking Words
at the end
.Linking Words