
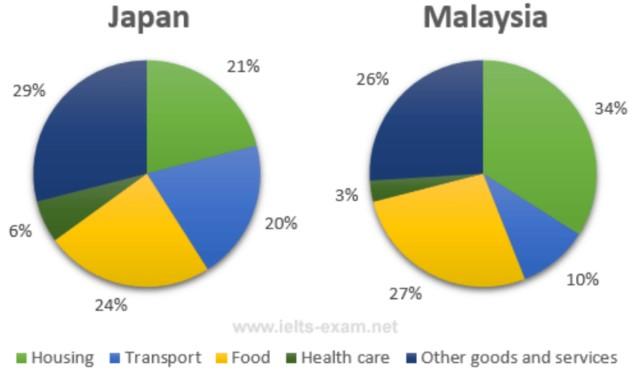
The chart above depicts information about common domestic spending concerning five distinct categories in Japan and
Malaysia
in the year 2010, and it is measured in percentage. As it is observed, the Japanese like to splurge for other goods and services, Use synonyms
while
Malaysians are more interested in owning properties.
It is conspicuous that Japanese and Malaysian households have different priorities when it comes to their needs. Linking Words
To begin
with, residence for couples who live in Linking Words
Malaysia
is indispensable, Use synonyms
accounted
for 34 per cent, Wrong verb form
accounting
while
in Japan it is lower with approximately 21 per cent. Linking Words
Moreover
, food which is a crucial thing for living stands at a 27 rate in Linking Words
Malaysia
Use synonyms
whereas
Japan shares nearly the same figure as a 24 ratio. Moving on to the third essential need of the residents in Linking Words
Malaysia
is other goods and services (26%). Use synonyms
In contrast
, additional products and assistance are the largest proportion in The Land of The Rising Sun.
Linking Words
Finally
, vehicles play a major role in Japanese households with a figure of 20% Linking Words
whereas
in the opposite country possessed only half of it. Followed by health care which has the smallest amount of number in both nations compared to other classifications.Linking Words