
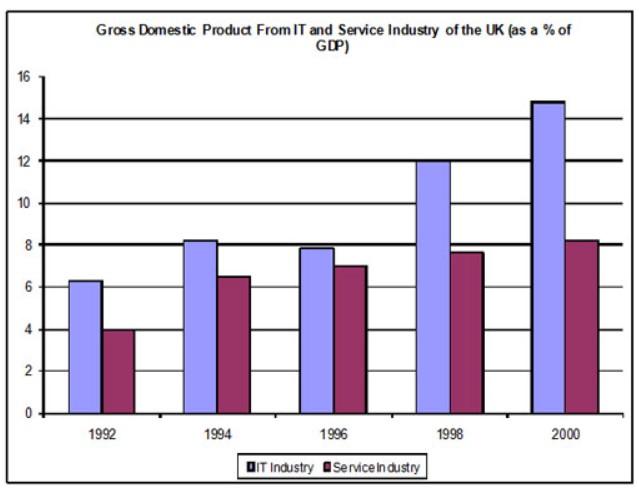
The supplied graph depicts the proportion of
GDP
's components produced by IT and service industries in the United Kingdom from 1992 to 2000.
Use synonyms
Overall
, it can be seen that both IT and service institutes experienced an upward trend, but IT had a much higher ratio during entire the 8-year period.
Linking Words
According to
the IT sector, the ratio of Linking Words
GDP
production began at just above 6% in 1992. After that, Use synonyms
this
number increased by 2% to become 8% in 1994. Linking Words
Moreover
, in the next four years, the Linking Words
GDP
was produced by 12% which continued climbing steadily and hit a peak of more than 14% in 2000.
Use synonyms
On the other hand
, in 1992, the percentage of generated Linking Words
GDP
by the service industry was 4%. These figures kept rising and reached almost 8% in 1998 before Use synonyms
witnessed
a significant decline in the past four years and remained stable and elevated marginally by 1% in 2000.Wrong verb form
witnessing