
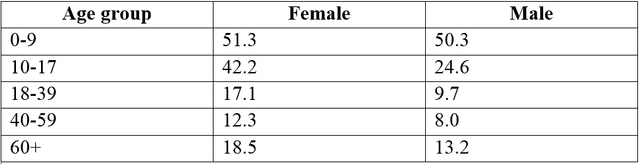
The table gives a comparison of population proportion in one town who rode bicycles in 2011 between five
age
groups.
Use synonyms
Overall
, most cycling Linking Words
group
of both Use synonyms
genders
are children between Use synonyms
age
0-9, Use synonyms
in contrast
of adults between Linking Words
age
40-59, which proportion are lowest.
Data on the figures illustrates that children between Use synonyms
age
0-9 have small difference in Use synonyms
genders
: females are 51.4% and males are 50.3%. Next Use synonyms
age
Use synonyms
group
between 10-17 shows the significant change in proportion: 42.2% and 24.6% respectively. Use synonyms
Age
Use synonyms
group
between 18-39 experienced dramatically fall in both Use synonyms
genders
to 17.1% and 9.7% respectively.
Compared with other Use synonyms
age
groups, Use synonyms
age
Use synonyms
group
between 40-59 illustrates the lowest usage of bicycle in both Use synonyms
genders
: females are 12.3% and males are 8%. Use synonyms
Finally
data on the figures shows that adults 60 and more olds preferred ride bicycles more than other adults Linking Words
age
groups and experienced slightly increase 18.5% and 13.2% respectively.Use synonyms