
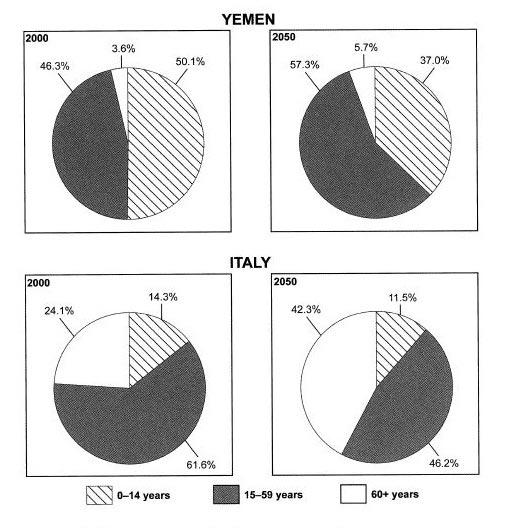
The pie charts detail the information and prediction about the population of
Yemen
and Italy by age in 2000 and 2050. Looking from an Use synonyms
overall
perspective, it is readily apparent that Linking Words
people
aged 15-59 Use synonyms
years
recorded the largest proportion except for Use synonyms
Yemen
in 2000. Use synonyms
Also
, the number of elderly was the lowest in Linking Words
Yemen
, but it showed quite a higher population in Italy. In regard to young Use synonyms
people
, Use synonyms
Yemen
was more than Italy.
As the data clearly shows, in 2000, Use synonyms
people
aged 0-14 Use synonyms
years
were the highest proportion by 50.1%, which was slightly bigger than 15-59 Use synonyms
years
(46.3%). The elderly Use synonyms
was
the lowest at 3.6%. In 2050, compared to 2000, 15-59 Correct subject-verb agreement
were
years
rose significantly to 57.3% over young children(37.0%) Use synonyms
while
older Linking Words
people
remained below 10%.
When it comes to Italy, they showed a different trend, unlike Use synonyms
Yemen
. In 2000, Use synonyms
people
aged 15-59 Use synonyms
years
accounted for the largest rate 61.6%, followed by 60+ Use synonyms
years
(24.1%), and 0-14 Use synonyms
years
(14.3%). One notable thing is the growth of the elderly's proportion, which increased to 42.3%. Use synonyms
However
, 0-14 Linking Words
years
fell to 11.5%.Use synonyms