
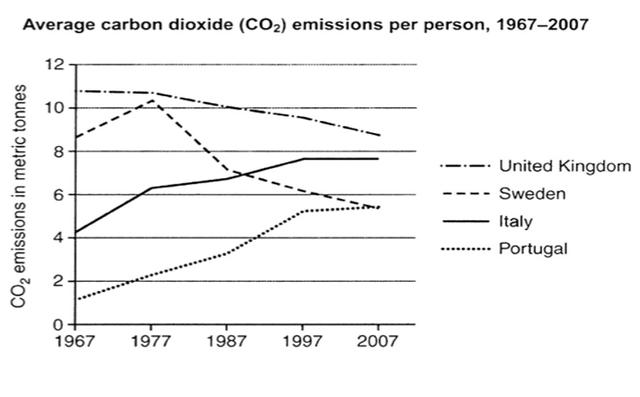
The chart illustrates the average amount of carbon dioxide emitted per person over a period of 40 years in four different countries.
It is clear that
the average Linking Words
emissions
generated by each individual in the United Kingdom are more than others. Use synonyms
However
the lowest amount is related to people in Portugal, but the figure experienced a significant rise during the period.
In 1967, around 11 metric Linking Words
tonnes
of Use synonyms
emissions
were produced per person in the United Kingdom. Each person in Sweden was Use synonyms
also
responsible for just under 9 Linking Words
tonnes
, Use synonyms
while
the figures for Italy and Portugal were around 4.5 and 1.5 Linking Words
tonnes
, respectively.
The CO2 Use synonyms
emissions
from the people living in Portugal jumped to just over five metric Use synonyms
tonnes
in 1997 and Use synonyms
then
Linking Words
leveled
off by 2007. In Italy, the figure increased gradually, until it leapfrogged the figure relevant to Sweden in about 1990. Change the spelling
levelled
In contrast
, Linking Words
emissions
from Use synonyms
the
individuals in the UK decreased steadily by about 2 metric Correct article usage
apply
tonnes
.Use synonyms