The bar chart below shows the number of overseas students enrolled in a second year Graphic Design course at a college in the south of England. Write a report for a university lecturer describing the information shown.

The bar chart below shows the number of overseas students enrolled in a second year Graphic Design course at a college in the south of England.

Write a report for a university lecturer describing the information shown.
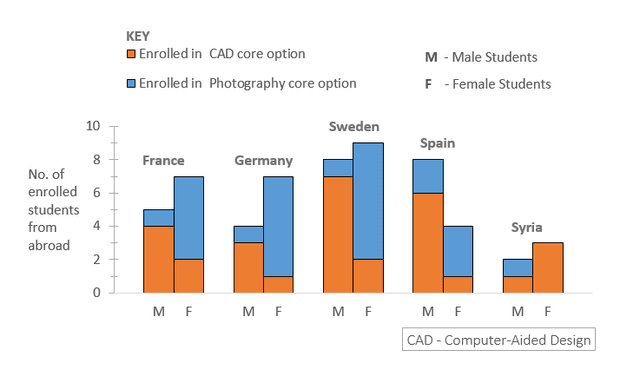
The chart illustrates the registration of foreign students for the mid-year Graphic Design Programme in a College in South England. The subjects included in
this
course are CAD
core
and
Photography
core
respectively.
Also
, students from France, Germany, Sweden, Spain, and Syria are enrolled.
Overall
, the majority of the male students prefer CAD
Core
, and
on the other hand
Photography
Core
option is more common among the female party.
Firstly
, the highest enrollment for CAD
Core
can be seen among male learners from Sweden which is 7 in count, and for the
Photography
Core
females recorded an enrollment of 6, which is the highest in the same country. Meanwhile, the Second top amount of participants of males for Computer Aided Design is from Spain, and females for
Photography
Core
are from Germany. The lowest attendance for both subjects is presented from Syria.
Submitted by hasi13r on

Unauthorized use and/or duplication of this material without express and written permission from this site’s author and/or owner is strictly prohibited. Excerpts and links may be used, provided that full and clear credit is given to Writing9 with appropriate and specific direction to the original content.

Common mistake: Your writing should be 150-250 words.
Basic structure: Change the third paragraph.
Vocabulary: Replace the words core, photography with synonyms.
Vocabulary: Only 4 basic words for charts were used.
Vocabulary: Use several vocabularies to present the data in the second paragraph.
Vocabulary: Use several vocabularies to present the data in the third paragraph.
Topic Vocabulary:
  • bar chart
  • overseas students
  • enrolled
  • Graphic Design course
  • trends
  • fluctuations
  • steady increase/decrease
  • significant
  • minor changes
  • enrollment
  • popular
  • diverse nationalities
  • academic year
  • compared to
  • dominate
  • in contrast
  • percentage
  • proportion
  • visual representation
What to do next:
Look at other essays: