
The chart illustrates the amount of
car
Use synonyms
journeys
that the Use synonyms
residents
and non-Use synonyms
residents
made to the city centre.
Use synonyms
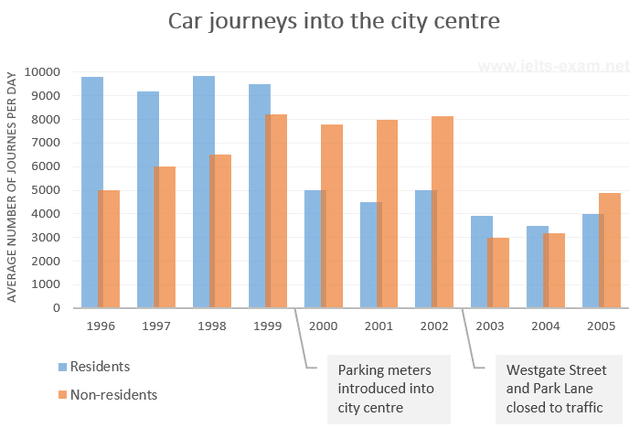
Overall
, from 1996 to 1997, Linking Words
residents
' vehicle Use synonyms
journeys
showed a steady Use synonyms
number
Use synonyms
while
non-Linking Words
residents
continued to rise rapidly. Use synonyms
However
, Linking Words
this
situation changed when two major events occurred, that are the introduction of parking meters and the closing of Westgate Street and Park Lane Linking Words
due to
traffic. The high Linking Words
number
of vehicle Use synonyms
journeys
in the past has now declined.
The introduction of parking meters in 2000 showed a dramatic change in Use synonyms
residents
' Use synonyms
car
Use synonyms
journeys
, making the average Use synonyms
number
go from approximately 9000 to 5000 each day. Use synonyms
However
, non-Linking Words
residents
average Use synonyms
car
Use synonyms
number
remained steady at around 8000 Use synonyms
journeys
per day.
When traffic closed Westgate Street and Park Lane in 2003, Use synonyms
residents
Use synonyms
journeys
slightly decreased from 5000 to 4000. but later stabilised. Changes can be seen in Use synonyms
non-resident
Correct article usage
the non-resident
car
journey as it fell drastically from 8000 to 3000.Use synonyms