
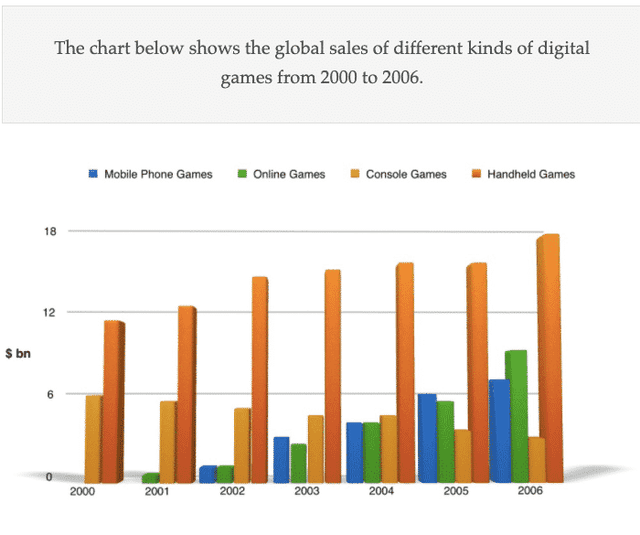
The bar chart illustrates the
value
of global sales in the billions of four different types of digital Use synonyms
games
throughout six years in a row from 2000.
In the six-Use synonyms
year
period given, the selling of handheld Use synonyms
games
always led the game industry. Use synonyms
This
figure moderately increased from slightly under 12 Linking Words
billion
Use synonyms
Dollars
in the first Use synonyms
year
to almost 18 Use synonyms
billion
Use synonyms
Dollars
in the final Use synonyms
year
. Use synonyms
Conversely
, console Linking Words
games
show a downtrend to only around 3 Use synonyms
billion
Use synonyms
Dollars
in 2006, which is half of the initial Use synonyms
value
.
Online Use synonyms
games
appeared for the first time in 2001 and experienced a constant increase to around 9 Use synonyms
billion
Use synonyms
Dollars
by the end of the period, which is the Use synonyms
second highest
sales Add a hyphen
second-highest
value
. A Use synonyms
year
after online Use synonyms
games
appeared, mobile phone Use synonyms
games
started to sell and were directly equal Use synonyms
with
the Change preposition
to
value
of online Use synonyms
games
. Use synonyms
This
number grew gradually and reached about 7 Linking Words
billion
Use synonyms
Dollars
in five years.
Use synonyms
Overall
, handheld Linking Words
games
had the biggest sales in each Use synonyms
year
given. Use synonyms
In addition
, handheld Linking Words
games
, online Use synonyms
games
, and mobile phone Use synonyms
games
increased moderately throughout the period given. Use synonyms
On the other hand
, only console Linking Words
games
underwent a decrease.Use synonyms