
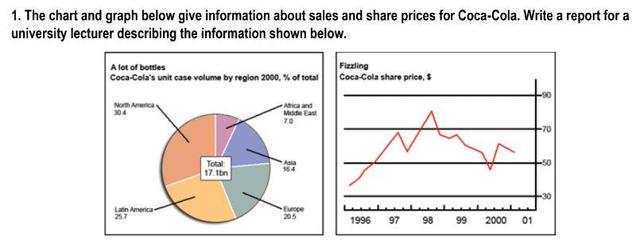
The diagrams above provide data regarding sales and share prices for Coca-Cola.
In the first diagram, it was shown that the total purchases of Coca-Cola in all regions were 17.1 billion bottles.
However
, the second diagram, which comes in a line chart, describes that the company's worldwide prices fluctuated from 1996 to 2001.
In detail, the pie graphic shows that the highest Coca-Cola unit case volumes were distributed to North America with a share of above a third. Linking Words
In contrast
, the lowest proportion was claimed by Africa and the Middle East with only 7 per cent of the total units. Meanwhile, Latin America, Europe, and Asia stood in the middle of both regions with a percentage range from 16 per cent to 30 per cent.
Linking Words
Furthermore
, the line graph shows that 1996 saw a low start in shared prices. It stood between 30 to 50 dollars and continued to rise until it reached almost 70 dollars in 1997. Linking Words
Moreover
, it experienced a slight drop until it reached its peak in 1998. Afterwards, the worth of a bottle of the beverage brand cumulatively decreased to under 50 dollars in 2000, before it fluctuated again in the year 2001.Linking Words