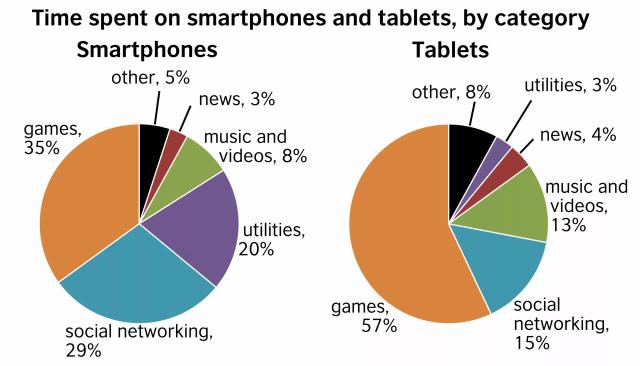
The pie charts below show the data regarding the time people spend on smartphones and tablets, divided by category.

The pie charts below show the data regarding the time people spend on smartphones and tablets, divided by category.
these two pie
carts
Correct your spelling
charts
show examples
provides
Change the verb form
provide
show examples
statistical data about how people
spent
Wrong verb form
spend
show examples
time on
gadges
Correct your spelling
gadgets
such
as smartphones or tablets. As it can be observed games occupy the largest segment on both devices being
in contrast
with news. In the first pie
chart
Add a comma
chart,
show examples
it can be observed that games
has
Change the verb form
have
show examples
Submitted by iftenevlad on

Unauthorized use and/or duplication of this material without express and written permission from this site’s author and/or owner is strictly prohibited. Excerpts and links may be used, provided that full and clear credit is given to Writing9 with appropriate and specific direction to the original content.

Introduction: The introduction is missing.
Introduction: The chart intro is missing.
Basic structure: Write more paragraphs.
Basic structure: Add more body paragraphs.
Common mistake: Your writing should be 150-250 words.
Introduction: The chart intro is missing.
Basic structure: Write more paragraphs.
Vocabulary: Rephrase the word "data" in your introduction.
Vocabulary: Only 4 basic words for charts were used.
Topic Vocabulary:
  • Digital devices
  • Proportion
  • Communication
  • Entertainment
  • Work-related tasks
  • Productivity
  • Miscellaneous activities
  • Time distribution
  • Prevalence
  • Dedicate
  • Allocate
  • Examine
  • Observation
  • Impact
  • Time management
  • Edit documents
  • Professional communication
  • Personal finance management
  • Streaming services
  • Social media platforms
What to do next:
Look at other essays: