
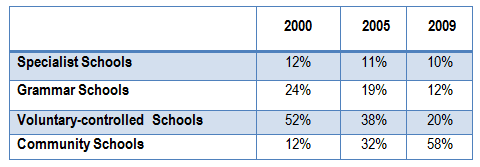
The table displays statistics of children's enrollment in four different types of educational institutions from 2000 to 2009.
Overall
, the most noticeable trend is that there has been a decrease in all of the department's attendance over the period, except for community schools which increased between 2000 and 2009.
Specialist learning centres started at just a small minority and their apprentices declined every year until they reached a low level of about 10% in 2009. Community Linking Words
academy
began the recorded period with exact figures Fix the agreement mistake
academies
to
Specialist Change preposition
for
institution
, but Fix the agreement mistake
institutions
in contrast
, Linking Words
this
consistently moved up throughout the years to hit a peak of 58% in 2009.
Linking Words
Initially
, Voluntary-controlled institute learners were over a half, but Linking Words
this
jumped rapidly to 38% the following year, before plummeting to a fifth in 2009. Linking Words
Finally
, the grammar seminary began the recorded period at almost a quarter, but through the remaining times, Linking Words
subsequently
fell to students of just over 12%.Linking Words