
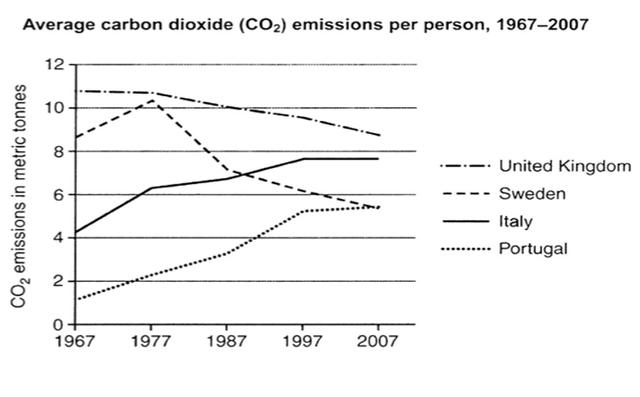
The chart compares the ordinary amount of carbon dioxide emission per person during a 40-year interval in four different regions including the
UK
, Use synonyms
Sweden
, Italy and Portugal.
Use synonyms
Overall
, it is explicit that the Linking Words
UK
and Use synonyms
Sweden
followed a downward trend within the period; Use synonyms
although
, the statistics Linking Words
of
Italy and Portugal have increased in comparison with the initial phase.
Focusing on the Change preposition
for
UK
and Use synonyms
Sweden
, what stands out from the scheme is that the data of both of them declined; Use synonyms
however
, the former started to Linking Words
declined
steadily and the latter followed a series of Change the verb
decline
fluctuation
. In more detail, the Fix the agreement mistake
fluctuations
UK
had the greatest details at Use synonyms
first,
Linking Words
roughly
11 CO2 emissions in metric tonnes, but it reached approximately 9 Change preposition
with roughly
at the end
. Linking Words
Moreover
, Linking Words
Sweden
ranked second; but subsequent to a peak of 10.5, it dropped suddenly to less than 6 in 2007.
Regarding Italy and Portugal, it can be seen that Use synonyms
whereas
they had the third and fourth positions in 1967, with the information of a bit more than four and less than two respectively; they started to grow gradually to be accounted for nearly 8 and 5.5 in 2007 separately.Linking Words