
The table gives information about the number of visitors to Ashdown Museum
while
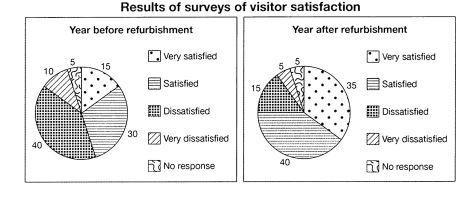
the pie charts illustrate the level of visitor satisfaction. The statistics are taken from the years before and after the refurbishment of the museum.
It is noticeable that in the year following the improvements more people went to the museum and they generally felt more satisfied after their visit.
Looking at the figures in the table, visitor numbers went up from 74,000 to 92,000 after the renovations. Linking Words
This
is a significant increase of 18,000, Linking Words
or7
just under 25%.
Turning to the pie charts, it is interesting to see that visitors who felt very satisfied or satisfied rose considerably from 45% before it was refurbished to 75% after. Correct your spelling
or
Conversely
, the proportion of those who were dissatisfied or very dissatisfied more than halved, from 50% before the changes to 20% after. Linking Words
Finally
, the proportion of visitors who did not respond to the survey remained unchanged at just 5% in both years.Linking Words