
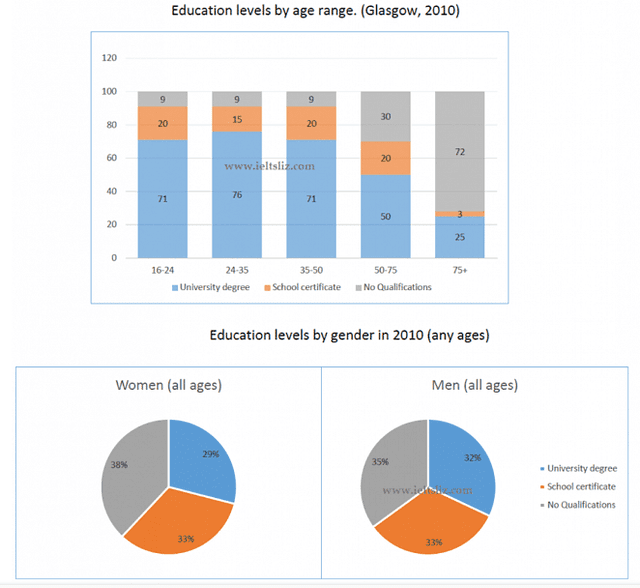
The graphs depict education levels categorised by age range and gender in a particular city in Scotland, Glasgow, in the year 2010.
Overall
, most adults graduated from university in comparison to the elderly group which was dominated by having no qualifications. Linking Words
Moreover
, the majority of the population, regardless of sex, of all ages was predominantly uneducated individuals, followed by the proportion of those who had school qualifications.
Regarding the bar diagram, people aged 16-50 had the highest number, over 70, as opposed to the least in a 75-year-old group (25 in total) in university degrees. Linking Words
By contrast
, the latter had the biggest total of no qualification populace, peaking at 72, as opposed to the former which had only 9 persons. Linking Words
Additionally
, the age groups that had the highest number of school certifications were 16-24, 35-50, and 50-75, having the same share of 20.
From the pie chart, both genders had the same portion of the people who had school certificates, 33 total. Linking Words
On the other hand
, the societies that did not attend any educational institutions had the lion's share, over a Linking Words
third,
in both men and women compared to the university graduation, 32 and 29 respectively.Linking Words