
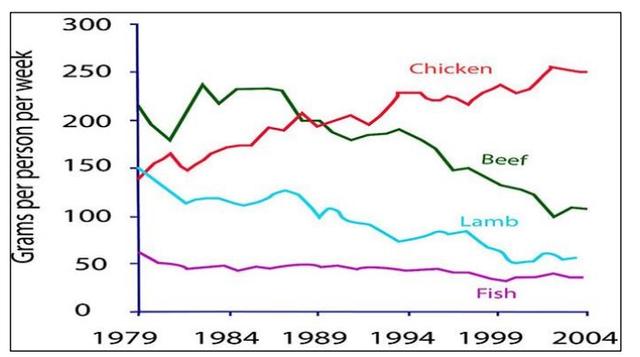
The line graph compares fish and meat utilization in European countries for a period of 2.5 decades from 1979 to 2004.
Whereas
the X-axis shows the year, the Y-axis illustrates the quantity per person in a week.
Linking Words
Overall
, what stands out from the plot is that fish consumption was in equilibrium. Another interesting point is that though the demand for Chicken was increasing, it was decreasing for Beef and Lamb.
Looking at the details, with regards to meat, utilization of Chicken was the lowest at less than 150 ancestors in 1979, but the highest was for Beef at 220 Grams. The demand for Lamb was 150 granny in 1979, Linking Words
then
it declined dramatically to around 50 in 2004. Linking Words
Although
, in the first two years consumption of Beef decreased, next two years it rocketed to a peak of about 250. After that, it gradually fell to approximately 100 in 2004. Linking Words
In contrast
, demand for chicken increased until peaked at 250 Grams before slipping back to 245 matriarchs in 2004.
Linking Words
However
, in the case of Fish, first two years its diminishing rate was high and shrank from 60 in 1979 to 45 in 1981. It, Linking Words
nevertheless
, fluctuates over the period within a certain limit of 45 and 40.Linking Words