
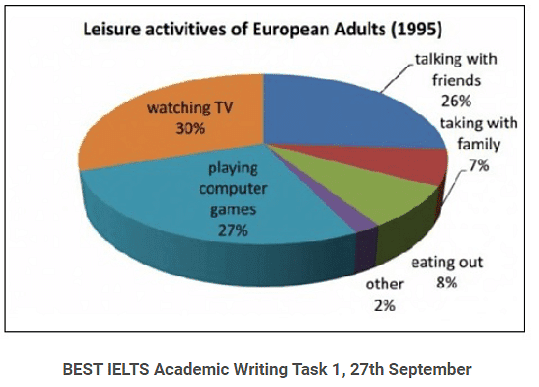
The presented diagram delineates the percentage of four actions which were done by adults
at
their free time in 1985 and 1995. In general, it is conspicuous that both in 1985 and Change preposition
in
in
1995 the most popular activity was watching Change preposition
apply
a
television.
Turning to the top two highest Remove the article
apply
number
of actions, watching television was the most Fix the agreement mistake
numbers
favorable
option selected by people in the time observed periods, Change the spelling
favourable
by
32% in 1995 and 30% in 1995. Change preposition
with
In addition
, in 1985 eating out contributed 23% and took the second highest place; Linking Words
however
, after 10 years, Linking Words
this
position was replaced by playing computer games (27%), Linking Words
then
ending at the fifth position (8%).
As regards the rest of the categories, talking with friends contributed 21% in 1985, and Linking Words
then
increased slightly by 5% in 1995. Linking Words
Additionally
, there was an interesting point that playing computer games became Linking Words
favorable
for mature people at just Change the spelling
favourable
across
a quarter in the end period even though it was nothing in the beginning.Change preposition
apply