
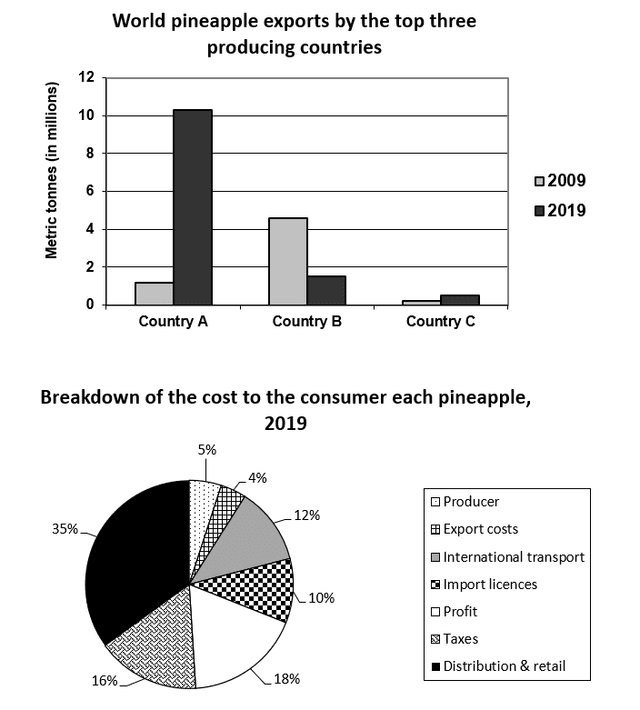
The given charts illustrate the exports of world pineapple by the top major three pineapple-producing states in 2 different years, 2009 and 2019, and a cost detail to the buyer of each pineapple in 2019. Units are measured in metric
tonnes
for the first chart.
Use synonyms
Overall
, it can clearly be seen that there were major position Linking Words
change
between 2009 and 2019. In 2009, Fix the agreement mistake
changes
country
B was the leading state, Use synonyms
while
in 2019, it was overtaken by state A. Linking Words
In contrast
, Linking Words
country
C remained the lowest.
In terms of the highest pineapple-producing nation at the start, Use synonyms
country
B started at approximately 4.5 metric Use synonyms
tonnes
in 2009. It Use synonyms
then
experienced a significant decline to below 2 metric Linking Words
tonnes
in 2019. Meanwhile, Use synonyms
country
A began at roughly 1.5 metric Use synonyms
tonnes
before soaring significantly to just above 10 metric Use synonyms
tonnes
in 2019 and overtaking Use synonyms
country
B. Use synonyms
On the other hand
, Linking Words
country
C started at less than 0.5 metric Use synonyms
tonnes
and remained stable until 2019.
Regarding the breakdown of the cost in 2019, distribution and retail constituted 35%, which made it the highest cost to the consumer, Use synonyms
and
followed by profit and taxes, which accounted for 18% and 16%, respectively. Correct word choice
apply
Moreover
, international transport stood at 12%. The Linking Words
rests
are producer, export costs, and import license, which if combined constituted less than 20%.Fix the agreement mistake
rest