
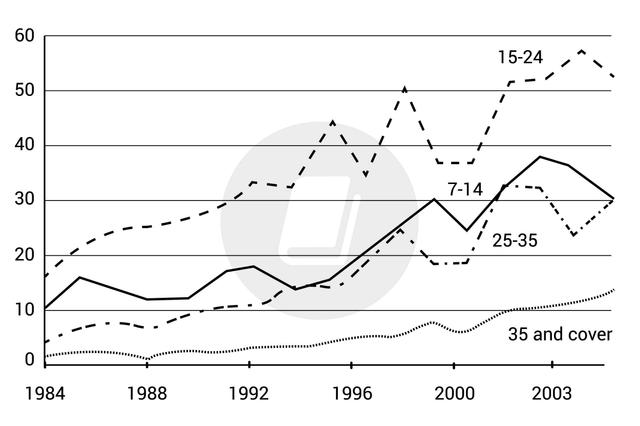
The line graph illustrates the rates of society based on four different generation classes who went to the movie theatre in one month over 1 decade from 2000 to 2011.
Overall
, as can be seen, the theatre was most popular and attended by young people aged 15-24 Linking Words
while
the cinema became infrequent to the elderly. Children and mature ages were in the middle of the trend number.
Linking Words
Initially
, in 1984, the percentage of young people (aged 15-24) was the highest among the three categories at just below 20%. They grew dramatically over the period and stood at first place in 2011 more than half per cent. For the children (7-14), they started at 10% in popularity and increased steadily until 2010 before decreasing in subsequent years. Linking Words
Moreover
, the mature ages (25-35) showed an inclining movement from the beginning year until 2004 (approximately 3% and just over 20%, respectively). It remained stable for the next five years and rose to 32% in 2011. Linking Words
Finally
, elderly rates maintained the same level and started to soar slightly at the Linking Words
last
of the period.Linking Words