The pie chart below show the average household expenditures in Japan and Malasia in the year 2010

The pie chart below show the average household expenditures in Japan and Malasia in the year 2010
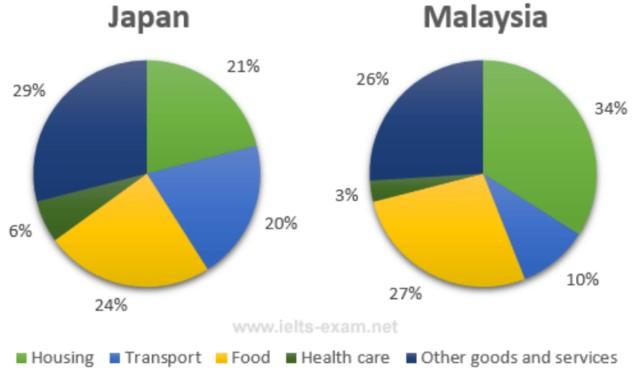
These pie charts illustrate the mid-range of household consumption in both countries of
Japan
and
Malaysia
in the year 2010. At one glance, it can be detected that most of the waste in
Malaysia
is caused by housing issues.
While
, in
Japan
, other goods and services have had been cost more than other items. Transporting and health care expenditures in
Japan
have been
having
Unnecessary verb
apply
show examples
double the range in
Malaysia
.
Whereas
, charts demonstrate items
such
as food and other goods and services did not differ much or have a minimally higher fraction.
Overall
, budget spending in
Japan
not only covered the basic needs of people but
also
resulted
from
Change preposition
in
show examples
better statements about public satisfaction in comparison to
Malaysia
.
Submitted by imaneslampanahiep on

Unauthorized use and/or duplication of this material without express and written permission from this site’s author and/or owner is strictly prohibited. Excerpts and links may be used, provided that full and clear credit is given to Writing9 with appropriate and specific direction to the original content.

Common mistake: Your writing should be 150-250 words.
Vocabulary: Replace the words japan, malaysia with synonyms.
Vocabulary: Rephrase the word "undefined" in your introduction.
Vocabulary: Only 4 basic words for charts were used.
Vocabulary: The word "charts" was used 2 times.
Topic Vocabulary:
  • household expenditures
  • average
  • pie chart
  • proportion
  • income
  • spending habits
  • cultural differences
  • economic differences
  • expenditure categories
  • priorities
  • lifestyle
  • income levels
  • cost of living
  • government policies
  • trends
  • globalization
  • imported goods
  • local products
What to do next:
Look at other essays: