
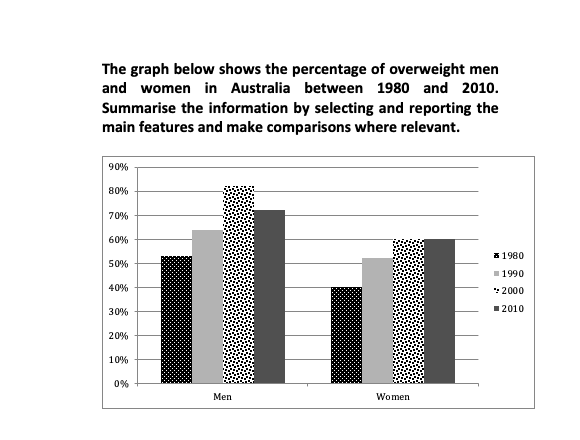
The aforementioned graph illustrates the amount of overweight Australian people classified by gender in 1980, 1990, 2000, and 2010. The data are measured in percentages and visualized in bar charts.
Overall
, a lot of Australian men were more obese than Australian women. Not only does the former have the highest record, but their overweight Linking Words
rate
Use synonyms
also
surpasses the latter each year. Linking Words
Whereas
the females did not have a steep record of increasing ratio but Linking Words
instead
a slight increase only per year.
The number of overweight males fluctuated per year. Linking Words
Firstly
, the Linking Words
rate
was around 46% in 1980. It rose narrowly to 51% in 1990 and reached its highest point in 2000 when the male population was 70% overweight. Use synonyms
This
situation only declined by around 2% in the next period. Linking Words
In contrast
, the Linking Words
rate
for overweight ladies had a low start of 30% in 1980. Use synonyms
Furthermore
, Linking Words
this
digit only elevated by 10% in 1990. For the Linking Words
last
two decades, the Linking Words
rate
peaked at 50%. It was still 20% lower than the men's overweight proportion.Use synonyms