
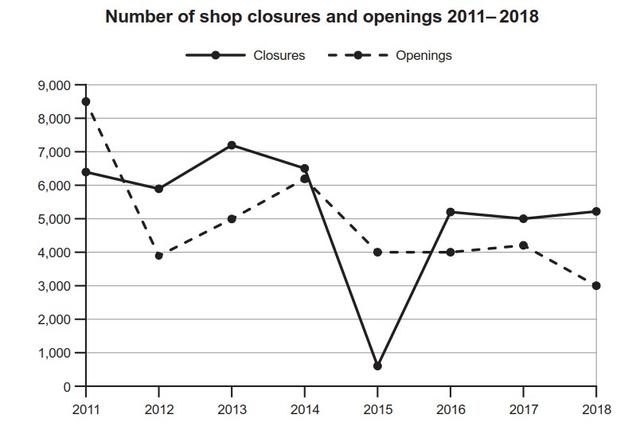
The given graph depicts the number of
stores
which were closed and opened in a country 7 years.
It is interesting to note that the amount of opened Use synonyms
stores
started with a large number at 8500 in 2011 but ended with gradual fluctuations which consisted of 3000 in 2018. Compared with closed Use synonyms
stores
, which kept the same amount at 3000 over a given period, despite the significant drops.
Moving to Use synonyms
further
details, opened Linking Words
stores
hit a peak at about 7000 in 2013 but fell markedly in 2015, almost by 6000. Use synonyms
Furthermore
, in 2014 results of the two trends were almost the same which Linking Words
were
nearly 6500.
Correct subject-verb agreement
was
Finally
, new Linking Words
stores
and closed Use synonyms
stores
remained constant between 2016 and 2017 with a slight difference in number, roughly by 1000. Use synonyms
Although
, in 2018 the gap between them was increasing.
Linking Words
Overall
, closures peaked at 6500 in 2011 and hit a low of about 500 in 2015. Openings hit a high of 8500 in the first year but the lowest point in the end.Linking Words