
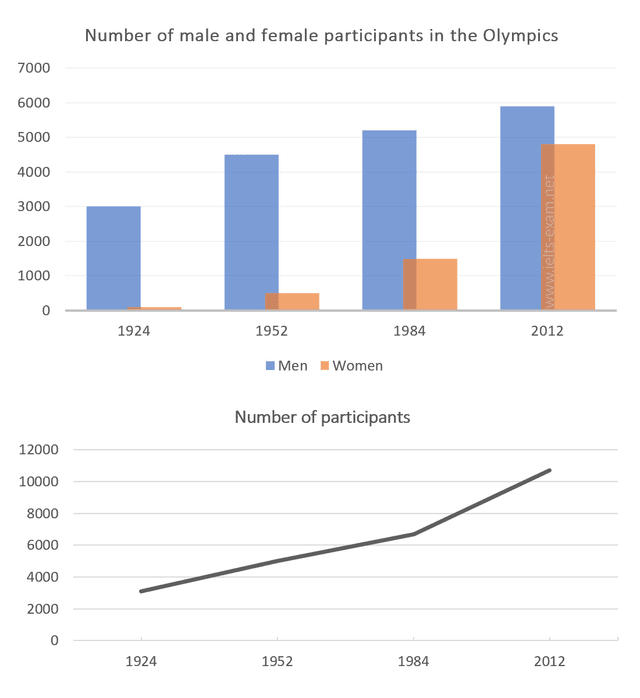
The bar chart and the line graph depict information about
participants
who have joined the Olympics since it started. Generally, the chart shows that male Use synonyms
participants
had been increasing steadily over the years. Use synonyms
While
in the line, Linking Words
graph
illustrates the significant changes in the number of Add an article
the graph
a graph
overall
Linking Words
participants
that had been growing over the years.
Use synonyms
Firstly
, the line graph shows that the Linking Words
statistic
of general Fix the agreement mistake
statistics
participants
who have joined the Olympics always increased from 1924 to 2012 and was able to hit more than ten Use synonyms
thousand
people.
Use synonyms
Also
, it can be seen that the chart shows that male Linking Words
participants
had the greatest number each year, they were able to reach nearly six Use synonyms
thousand
people in 2012. Use synonyms
Also
, the bars kept growing very steadily from 1924 to 2012. Linking Words
However
, from 1924 to 1952 there were only a few female Linking Words
participants
that joined the Olympics around less than one Use synonyms
thousand
people, but there was a noticeable rise in 2012, they were able to reach more than four Use synonyms
thousand
Use synonyms
participants
.Use synonyms