
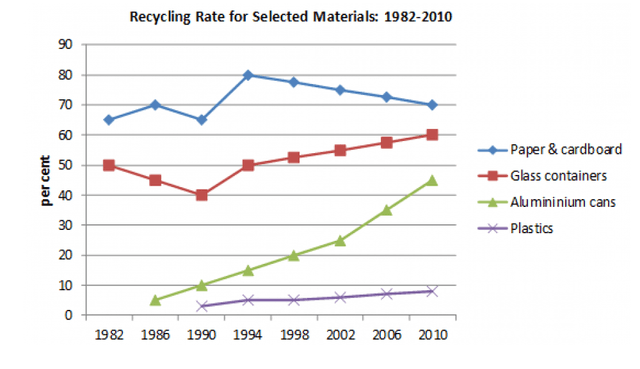
The line graph illustates about the data of a partcular country recycled different types of materials to reuse them from 1982 to 2010 ,
while
figures were calculated as percentages.
Linking Words
Overall
, paper and the cupboards were the largely recycled material for the given time period Linking Words
while
plastic were recycled at a lower Linking Words
rate
for 28 years.
Paper and cupboards started at exactly 65% at the begining of the period, that number increased to 70% in 1986 and again dropped to 65% in 1990.Use synonyms
Then
the recycling Linking Words
rate
had striked their peak of 80% in 1994 before it reduced to 70% in 2010.Use synonyms
On the other hand
, Glass containers were recycled at 50% in 1982 Linking Words
whereas
it considerably declined to 40% after eight years.Linking Words
However
, the Linking Words
rate
was gradually increased to 60% in 2010.
With regards to Aluminium cans, which were recycled at approximately 2% in 1982.Use synonyms
Then
the reclycling Linking Words
rate
rose significantly over the years and hit off at 45% Use synonyms
at the end
of the given timeline.Linking Words
Moreover
, It can be noticeable that recycling process of plasctic had a slow growth from the begining of the period which started with 1% and reached it to just under 10% in 2010.Linking Words