
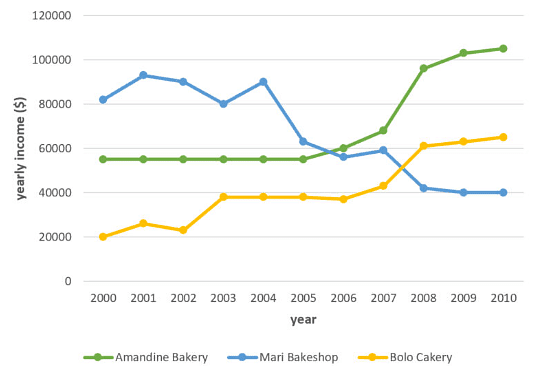
The given line graph demonstrates the information about the yearly income of 3 bakehouses in Calgary over the period of 10 years.
According to
the data, Mari Bakeshop has the highest proceeds at the beginning of the periodLinking Words
,
but demonstrates the poorest results in comparison with concurrents in 2010. Remove the comma
apply
Also
, Amandine Bakery and Bolo Cakery are the only one that compares an upward trend during the period.
In 2000-2004, Mari Bakeshop showed a fluctuation in earnings and reachedLinking Words
$
95000 maximum per year. Correct article usage
a $
However
, from 2004 to 2010, the income of the company decreases dramatically and amounts to $40000.
From 2000 to 2005, the profit of Amandine Bakery remained steady and achieved $60000 per year. Linking Words
Nevertheless
, from 2005 until 2010, the company‘s income rises rapidly and reaches $105000. Linking Words
Moreover
, Bolo Calery has the smallest annual earnings $20000. Linking Words
However
, during the next 10 years, the proceeds per year demonstrate an upward trend and amount to $65000.Linking Words