
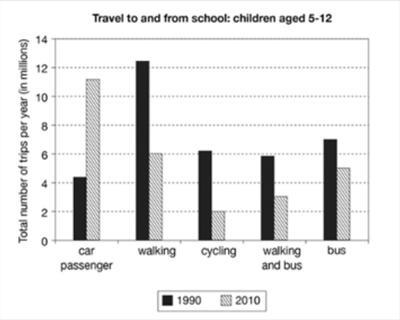
The bar chart illustrates the frequency of
trips
made by kids ages 5-12 in a certain country between 1990 and 2010 to travel to and from the place where they study, and the variety of Use synonyms
the
transport options that they take. Correct article usage
apply
Overall
, the main mode of transport changed, from walking in 1990 to using a car in 2010. The number of children that used a bike, a Linking Words
bus
, and a combination of walking and Use synonyms
bus
all dropped in 2010.
In 1990, walking was the top choice of transport for children with over 12 Use synonyms
million
Use synonyms
trips
taken. In comparison, using a private vehicle Use synonyms
such
as Linking Words
Correct article usage
a cars
cars
is not as popular, with just around 4 Fix the agreement mistake
car
million
Use synonyms
trips
. Use synonyms
This
changed drastically in 2010, with an extra addition of around 7 Linking Words
million
Use synonyms
trips
, making the number of car Use synonyms
trips
around 11 Use synonyms
million
in 2010. Even Use synonyms
then
, walking is still the second most popular Linking Words
options
with 6 Fix the agreement mistake
option
million
Use synonyms
trips
of walking to and from school.
Cycling, Use synonyms
bus
Use synonyms
,
and a combination of walking and Remove the comma
apply
bus
are all generally of the same popularity, with taking a Use synonyms
bus
being in the lead with around 7 Use synonyms
million
Use synonyms
trips
. The number of Use synonyms
trips
for all three dropped in 2010, with the most noticeable decrease in cycling, from just over 6 Use synonyms
million
in 1990 to 2 Use synonyms
million
in 2010. Even though not as drastic, a similar case can be seen for the combination of Use synonyms
Use synonyms
bus
and walks, going down around half from just under 6 Fix the agreement mistake
buses
million
in 1990 to roughly 3 Use synonyms
million
. The decrease Use synonyms
of
Change preposition
in
bus
usage is not as drastic, just dropping from roughly 7 Use synonyms
million
to about 5 Use synonyms
million
in 2010.Use synonyms