
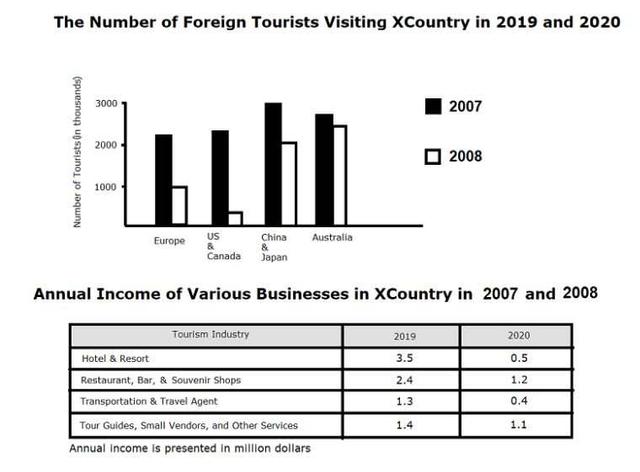
The given bar chart and table provide data about number of tourists and yearly income in each country in 2019 and 2020.
Overall
, the number of tourists fell in comparison to 2019 and the total profit of businesses became less satisfying in 2020.
The most visited countries in 2019 were China and Japan, Linking Words
although
the Linking Words
overall
tendency in tourism for the rest of the countries demonstrated stability in the same year. As for 2020, the least country which were visited by parents were The US and Canada.
It is clearly shown that the highest income (3.5 million dollars) in 2019 was from the Hotels and Resort industry. Linking Words
Nevertheless
, by 2020 Linking Words
this
industry became the least profitable industry among the others. Linking Words
Furthermore
, by 2020 Restaurants, Bars and Souvenir shops decreased profit by two times.
The data suggest that the decreased presence of tourists in listed countries leads to decreased profit for various businesses as well.Linking Words