
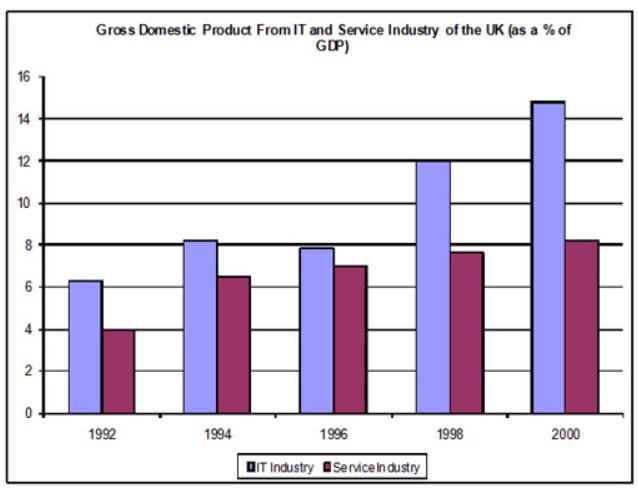
The chart depicts the Gross Domestic Product (
GDP
) from the IT and Use synonyms
Service
Use synonyms
industry
from the year 1992 to 2000 in the United Kingdom.
Use synonyms
Overall
, Linking Words
GDP
from the IT Use synonyms
sector
remained higher than the Use synonyms
Service
Use synonyms
industry
from 1992 to 2000. Use synonyms
Initially
, the Linking Words
difference
between Use synonyms
both
sectors was limited; Use synonyms
however
, in later years, the Linking Words
difference
was much more than in the past.
In 1992, Use synonyms
Use synonyms
GDP
from IT was around 6%, Correct article usage
the GDP
whereas
, from the Linking Words
service
Use synonyms
sector
, it was 4%. In 1994, in the IT Use synonyms
sector
, it Use synonyms
raised
nearly 8%, and in the Verb problem
rose
service
Use synonyms
industry
, it reached above 6%. In the year 1996, there was a minimal Use synonyms
difference
in the Use synonyms
GDP
from Use synonyms
both
industries (Use synonyms
both
were between 6 to 8%).
From 1998, the Use synonyms
difference
between Use synonyms
both
sectors in terms of Use synonyms
GDP
became more noticeable and continued in the year 2000. In 1998, the Use synonyms
GDP
of the IT Use synonyms
industry
was 12%, just a little less than 8% for the Use synonyms
service
Use synonyms
sector
. In 2000, the IT Use synonyms
sector
’s Use synonyms
GDP
rose more than 14% whilst for the Use synonyms
Service
Use synonyms
sector
it remained near 8% only.Use synonyms