
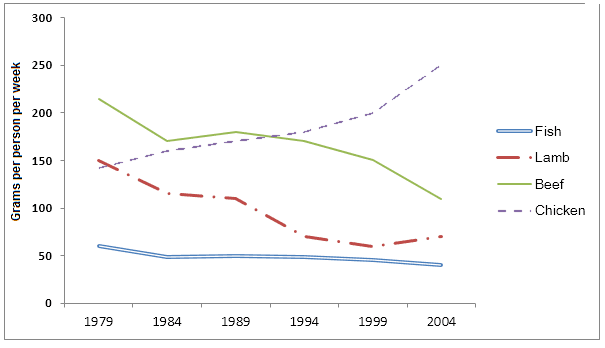
The line graph illustrates the weekly consumption of
fish
and other types of meat, namely Use synonyms
chicken
, Use synonyms
beef
, and Use synonyms
lamb
, in one European country from 1979 to 2004.
Use synonyms
Overall
, the Linking Words
grams
of consumed Use synonyms
chicken
rose steadily throughout the Use synonyms
period
, Use synonyms
while
the figure for Linking Words
beef
and Use synonyms
lamb
experienced a downward trajectory. The consumption of Use synonyms
fish
remained relatively stable over the whole Use synonyms
period
.
Regarding Use synonyms
beef
and Use synonyms
lamb
, in 1979, the amount of Use synonyms
beef
eaten was the highest, showing around 220 Use synonyms
grams
per person per week and Use synonyms
then
, it fell sharply by nearly 50 Linking Words
grams
in 1981. Starting in 1982, it showed a dramatic rise for a Use synonyms
while
and Linking Words
then
, dropped significantly from 240 Linking Words
grams
to almost 120 Use synonyms
grams
in the final year. The proportion of Use synonyms
lamb
Use synonyms
also
showed a similar pattern, beginning at 150 Linking Words
grams
in 1979 and ending close to 75 Use synonyms
grams
in 2004.
Turning to Use synonyms
chicken
and Use synonyms
fish
, the amount of Use synonyms
chicken
consumed stood at just under 150 Use synonyms
grams
per week in 1979. It overtook the Use synonyms
beef
with just over 200 Use synonyms
grams
in 1989 and continued its upward trend until the end of the Use synonyms
period
. Use synonyms
In contrast
, the figure for Linking Words
fish
remained relatively steady throughout the whole Use synonyms
period
, from 60 Use synonyms
grams
weekly consumption in 1979 to around 40 Use synonyms
grams
in 2004.Use synonyms