
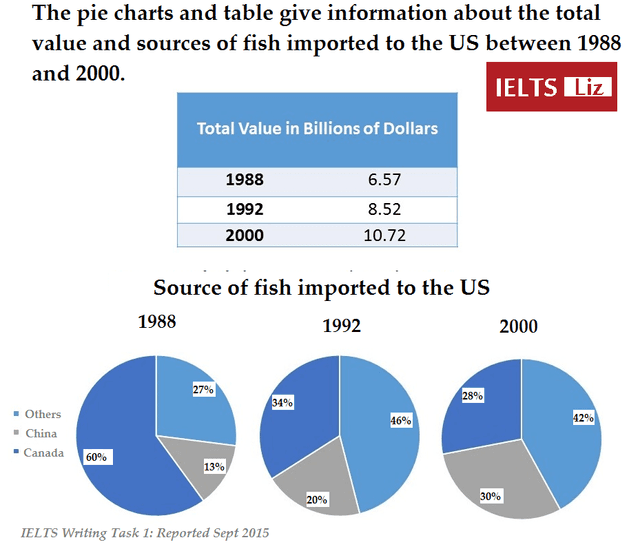
The two charts illustrate information about the
fish
imported to the United States of America. The pie chart displays the source of Use synonyms
fish
imported, Use synonyms
while
, the table chart shows the total Linking Words
value
of it in billions of Use synonyms
dollars
.
Use synonyms
To begin
with, the year 2000 marked the time with the highest total Linking Words
value
up to 10.72 billion Use synonyms
dollars
Use synonyms
due to
Linking Words
fish
import. Use synonyms
Moreover
, the highest proportion of exporters was Linking Words
Canada
with 60%, Use synonyms
others
27%, and Use synonyms
China
13%.
Use synonyms
On the other hand
, in 1992 the accumulation Linking Words
value
of Use synonyms
fish
import was about 8.52 billion Use synonyms
dollars
just a slightly below 3% difference from 2000. Most of the Use synonyms
fish
were exported from Use synonyms
Others
with 46% followed by Use synonyms
Canada
and Use synonyms
China
which accumulated 54% in total.
Use synonyms
Finally
, at the bottom, there was the year 1988 with a mere 6.57 total Linking Words
value
in billions of Use synonyms
dollars
. Use synonyms
Others
remained the highest source for Use synonyms
fish
import, Use synonyms
while
, Linking Words
China
switched a position with Use synonyms
Canada
as the second highest with 30%. Use synonyms
Next,
Linking Words
Canada
was the lowest with 28%.
Use synonyms
Overall
, Linking Words
Canada
has had a continuous growth since 1998 which started with a mere 28%. Use synonyms
In contrast
, Linking Words
China
and Use synonyms
Others
have experienced a steady fall since 1998.Use synonyms