
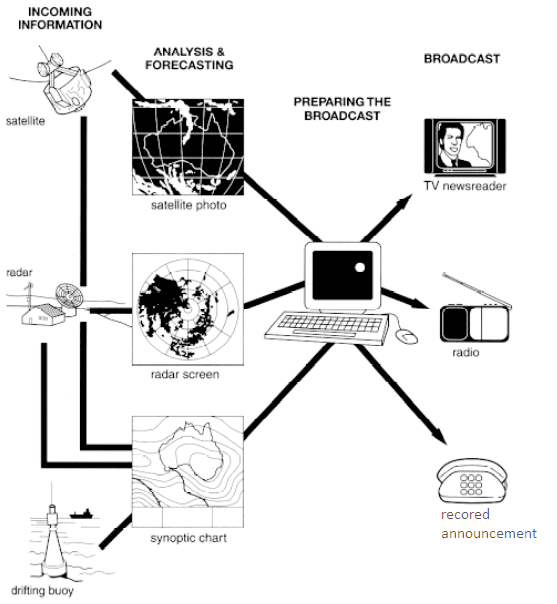
The diagram illustrates how real-time data of weather forecasting are broadcasted by the Australian Bureau of Meteorology. Looking from an
overall
perspective, it is readily apparent that the information is coming from three various systems and through some processes, the details are Linking Words
then
being able to distributed via several media.
Linking Words
Firstly
, real-time statistics from the field can be obtained from the spaces, the ground, and the sea with weather stations across the world. From space, satellites can produce photos. On the ground, there is a radar that can show a radar screen. From the sea, a drifting buoy collected a synoptic chart. All of Linking Words
this
info Linking Words
then
being analyzed and forecasted, one by one.
The next stage is to prepare the broadcast. All information from different sources is rolled into one server before going on air. The broadcasts are done through TV newsreaders, radio, or record announcements that can be consumed by people widely.Linking Words