The graph below shows the consumption of fish and some different kinds of meat in a European country between 1978 and 2003.

The graph below shows the consumption of fish and some different kinds of meat in a European country between 1978 and 2003.
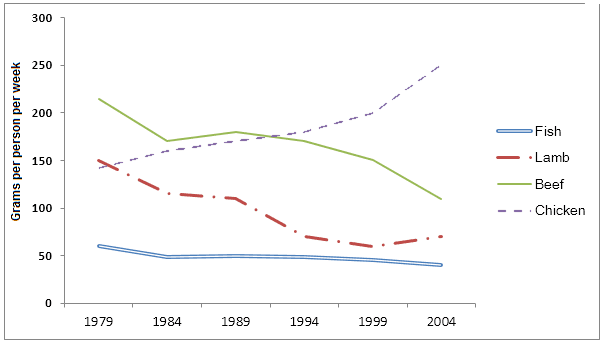
The line chart demonstrates how much of four different types of meat were consumed in a specific country in Europe over a twenty-five-year period from 1978 to 2003.
Overall
, what stands out from the graph is that the popularity of chicken rose considerably,
while
this
figure for the three other sorts of meat witnessed a fall.
Also
evident is in 1978 beef was consumed the most among people at about 220 grams per person per week,
while
fish was the lowest at around 55.
However
, the beef and fish consumption decreased to 110 and 55 respectively by the end of the period in question. As can be seen, at the beginning of the period both chicken and lamb were consumed the same amount at 150 grams.
Nevertheless
, after experiencing a fluctuation throughout half of a decade between 1983 and 1988, the former soared to 250 grams and the latter
plummet
Wrong verb form
plummeted
show examples
to 60.
Moreover
, in 2003 chicken was the most popular,
while
fish remained the least popular.
Submitted by shamim1999 on

Unauthorized use and/or duplication of this material without express and written permission from this site’s author and/or owner is strictly prohibited. Excerpts and links may be used, provided that full and clear credit is given to Writing9 with appropriate and specific direction to the original content.

Linking words: Don't use the same linking words: "while".
Introduction: The introduction is missing.
Introduction: Change the first sentence in the introduction.
Introduction: The chart intro is missing.
Vocabulary: Rephrase the word "undefined" in your introduction.
Topic Vocabulary:
  • consumption
  • fish
  • meat
  • poultry
  • beef
  • lamb
  • trend
  • increase
  • decrease
  • gradual
  • significant
  • fluctuate
  • peak
  • trough
  • steady
  • correlation
  • period
  • data
  • comparison
  • predominant
  • kilograms per capita
  • dietary habits
  • health consciousness
  • sustainability
What to do next:
Look at other essays: